The Collatz Conjecture: An Unsolved Mystery 🤯
Welcome to a journey into one of the simplest to state yet most notoriously difficult problems in mathematics: the Collatz Conjecture.
Also known as the 3n + 1 problem, the 3n + 1 algorithm, or Hasse's algorithm, the conjecture is built on a very basic rule applied to any positive integer *n*:
- If *n* is even, divide it by two (n / 2).
- If *n* is odd, multiply it by three and add one (3n + 1).
The conjecture states that if you start with any positive integer and repeatedly apply these rules, you will always eventually reach the number 1.
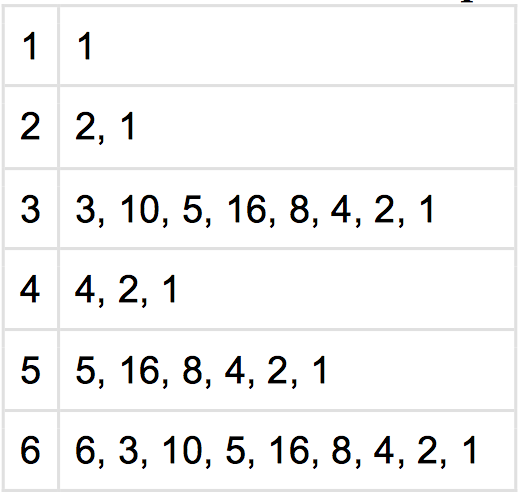
An Example Sequence
Let's start with the number 6:
6 → 6 / 2 = 3
3 → (3 × 3) + 1 = 10
10 → 10 / 2 = 5
5 → (5 × 3) + 1 = 16
16 → 16 / 2 = 8
8 → 8 / 2 = 4
4 → 4 / 2 = 2
2 → 2 / 2 = 1
The sequence for the starting number 6 is 6, 3, 10, 5, 16, 8, 4, 2, 1. The conjecture holds true! While this has been verified for all starting numbers up to incredibly large values (currently over 268), a formal mathematical proof that it holds for *all* positive integers remains elusive.
My Observations, Not a Proof
Please note: The purpose of this website is not to present a proof of the Collatz Conjecture. I am not a professional mathematician, and no universally accepted proof currently exists.
Instead, I am simply presenting my own observations about the sequences and patterns generated by this rule. Throughout the following pages, you will find interesting relationships, visual insights, and mathematical curiosities that I've found while exploring the conjecture.
Visualizing the Collatz Conjecture
Despite its simplicity, the Collatz Conjecture generates sequences that can be wildly unpredictable, making visualization a popular and powerful tool for exploration.
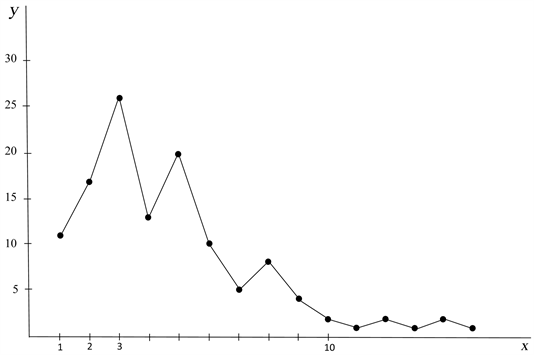
Collatz Sequences as Graphs
One of the most common ways to see the conjecture in action is by graphing the steps of a single sequence. These Collatz sequence graphs typically plot the step number on the *x*-axis against the value of the number in the sequence on the *y*-axis. They often demonstrate dramatic, seemingly random peaks before the sequence plunges down toward the final 4 → 2 → 1 loop.
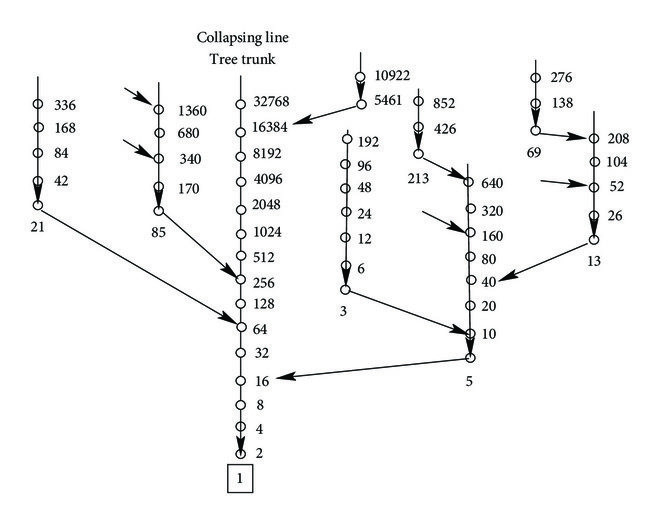
The Collatz Tree 🌳
Perhaps the most comprehensive visualization is the Collatz Tree (also called the Reverse Collatz Tree or Collatz Graph). Instead of starting at a number and going down to 1, this tree is built backwards from the number 1.
- If the current number *n* is reached by the 3n + 1 rule, the previous number was (n - 1) / 3. This only works if *n* is a specific type of number.
- If the current number *n* is reached by the n / 2 rule, the previous number was 2n.
By applying these reverse operations, a branching structure emerges, where every positive integer appears exactly once. This structure visually represents the idea that every starting number is eventually connected to the number 1. The sheer complexity and recursive nature of this tree highlight why a simple rule can generate such a difficult-to-prove conjecture.
0 The Collatz Binary Tree
Rather than viewing Collatz as a single sequence, we can visualize the total space of operations as an Infinite Binary Tree. Every integer N is associated with a specific path down the tree.
Corresponds to a division by 2 (N/2). The depth increases, but the power of 3 remains constant.
Corresponds to a multiplication-addition step (3N+1)/2. Both depth and the power of 3 increasesby one.
This tree is a map of Functional Composition. A path like Left-Right-Left represents the function:
f(x) = ((3(N/2)+1)/2)/2

Explore the other pages of this site to see the specific patterns and connections I've discovered in these sequences and visualizations!